1.3inch LCD HATにCloudWatchメトリクスのグラフを表示する
WaveShare 1.3インチ 240×240 IPS LCDディスプレイHAT for RaspberryPiを買ったので、 CloudWatchに保存しているBME280センサ情報を表示してみることにした。
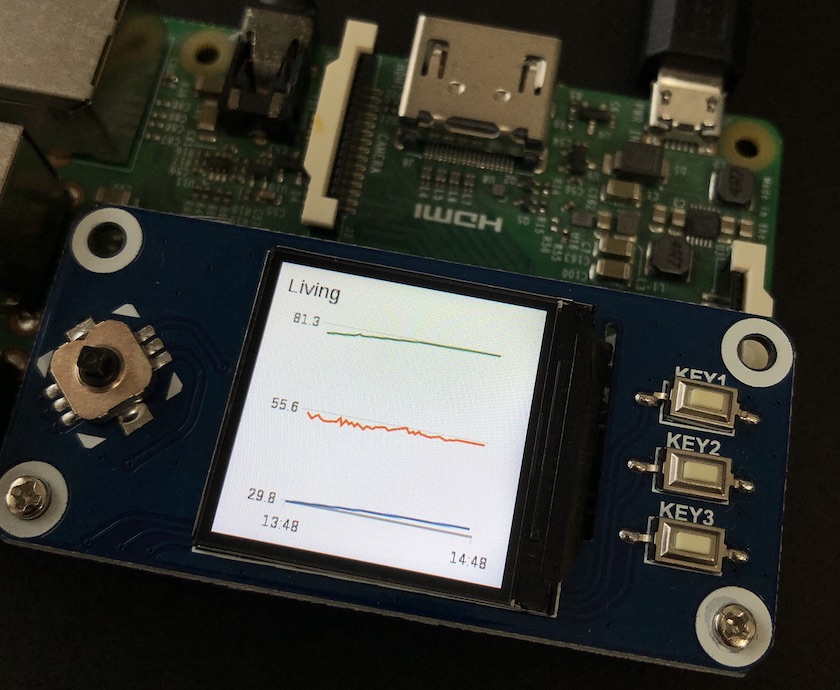
できたもの
- 現在の不快指数、温度、湿度を表示

- 直近一時間の変化をグラフ表示

上記を数分ずつ交互に表示するようにした。
設定方法
- 1.3inch_lcd_hat_user_manual_en.pdfの手順でセットアップ
1.3inch LCD HAT - Waveshare Wikiよりサンプルコードをダウンロード
CLIでCloudWatchからデータ取得できるようにawscliをインストール
apt install awscli
aws configure- noto-cjkフォントをインストール
sudo apt install fonts-noto-cjk- 現在のセンサ情報とグラフを表示するpythonスクリプトを作成(cloudwatch.py)
# coding:utf-8
import spidev as SPI
import ST7789
import time
import subprocess
import datetime
from pytz import timezone

from PIL import Image,ImageDraw,ImageFont
def metrics_graph():
  try:
    subprocess.check_call("aws cloudwatch get-metric-widget-image --metric-widget file://cloudwatch.json | jq -r '.MetricWidgetImage' | base64 --decode > ./graph.png", shell=True)
  except Exception as e:
    print e

def temp(start, end):
  try:
    cmd = 'aws cloudwatch get-metric-statistics --metric-name RaspberryPiZero2/temperature --period 60 --start-time %s --end-time %s --namespace Home --statistics Maximum | jq -r ".Datapoints[0].Maximum"' % (start, end)
    res = subprocess.check_output(cmd, shell=True).strip()
    if res == 'null':
      return '0'
    else:
      return '0' if res is None else res
  except Exception as e:
    print e
    return '0'

def humidity(start, end):
  try:
    cmd = 'aws cloudwatch get-metric-statistics --metric-name RaspberryPiZero2/humidity --period 60 --start-time %s --end-time %s --namespace Home --statistics Maximum | jq -r ".Datapoints[0].Maximum"' % (start, end)
    res = subprocess.check_output(cmd, shell=True).strip()
    if res == 'null':
      return '0'
    else:
      return '0' if res is None else res
  except Exception as e:
    print e
    return '0'

def di(start, end):
  try:
    cmd = 'aws cloudwatch get-metric-statistics --metric-name RaspberryPiZero2/discomfort_index --period 60 --start-time %s --end-time %s --namespace Home --statistics Maximum | jq -r ".Datapoints[0].Maximum"' % (start, end)
    res = subprocess.check_output(cmd, shell=True).strip()
    if res == 'null':
      return '0'
    else:
      return '0' if res is None else res
  except Exception as e:
    print e
    return '0'

def latest_metrics():
  end = datetime.datetime.utcnow()
  start = end - datetime.timedelta(minutes=1)
  end_iso = timezone('UTC').localize(end).isoformat()
  start_iso = timezone('UTC').localize(start).isoformat()

  t = temp(start_iso, end_iso)
  h = humidity(start_iso, end_iso)
  d = di(start_iso, end_iso)

  return t, h, d

def main():
  # Raspberry Pi pin configuration:
  RST = 27
  DC = 25
  BL = 24
  bus = 0
  device = 0

  # 240x240 display with hardware SPI:
  disp = ST7789.ST7789(SPI.SpiDev(bus, device),RST, DC, BL)

  # Initialize library.
  disp.Init()

  font = ImageFont.truetype('/usr/share/fonts/opentype/noto/NotoSansCJK-Regular.ttc', 30)

  while True:
    metrics_graph()
    temp, humidity, di = latest_metrics()

    ## Clear display.
    disp.clear()

    print "***draw text"
    image1 = Image.new("RGB", (disp.width, disp.height), "WHITE")
    draw = ImageDraw.Draw(image1)
    draw.text((30, 20), str.format('Living', di), fill = "BLACK", font = font)
    draw.text((30, 60), str.format('di  : {:.2f}', float(di)), fill = "BLACK", font = font)
    draw.text((30, 100), str.format('temp: {:.2f}', float(temp)), fill = "ORANGE", font = font)
    draw.text((30, 140), str.format('hum : {:.2f}', float(humidity)), fill = "BLUE", font = font)
    draw.text((30, 180), time.strftime('%H:%M'), fill = "BLACK", font = font)
    disp.ShowImage(image1,0,0)
    time.sleep(300)

    print "***draw graph"
    image = Image.open('./graph.png')
    disp.ShowImage(image,0,0)
    time.sleep(300)

main()- グラフ画像用のメトリクス定義ファイルを保存(cloudwatch.json)
{
    "metrics": [
        [ "Home", "RaspberryPiZero2/temperature", { "label": "temp", "period": 60 } ],
        [ ".", "RaspberryPiZero2/humidity", { "label": "humidity", "period": 60 } ],
        [ ".", "RaspberryPiZero2/discomfort_index", { "label": "di", "period": 60 } ]
    ],
    "view": "timeSeries",
    "stacked": false,
    "region": "ap-northeast-1",
    "yAxis": {
        "left": {
            "showUnits": false
        },
        "right": {
            "showUnits": false
        }
    },
    "legend": {
        "position": "hidden"
    },
    "title": "BME280",
    "width": 240,
    "height": 240,
    "start": "-PT1H",
    "end": "P0D",
    "timezone": "+0900"
}- スクリプト実行
python cloudwatch.py &